

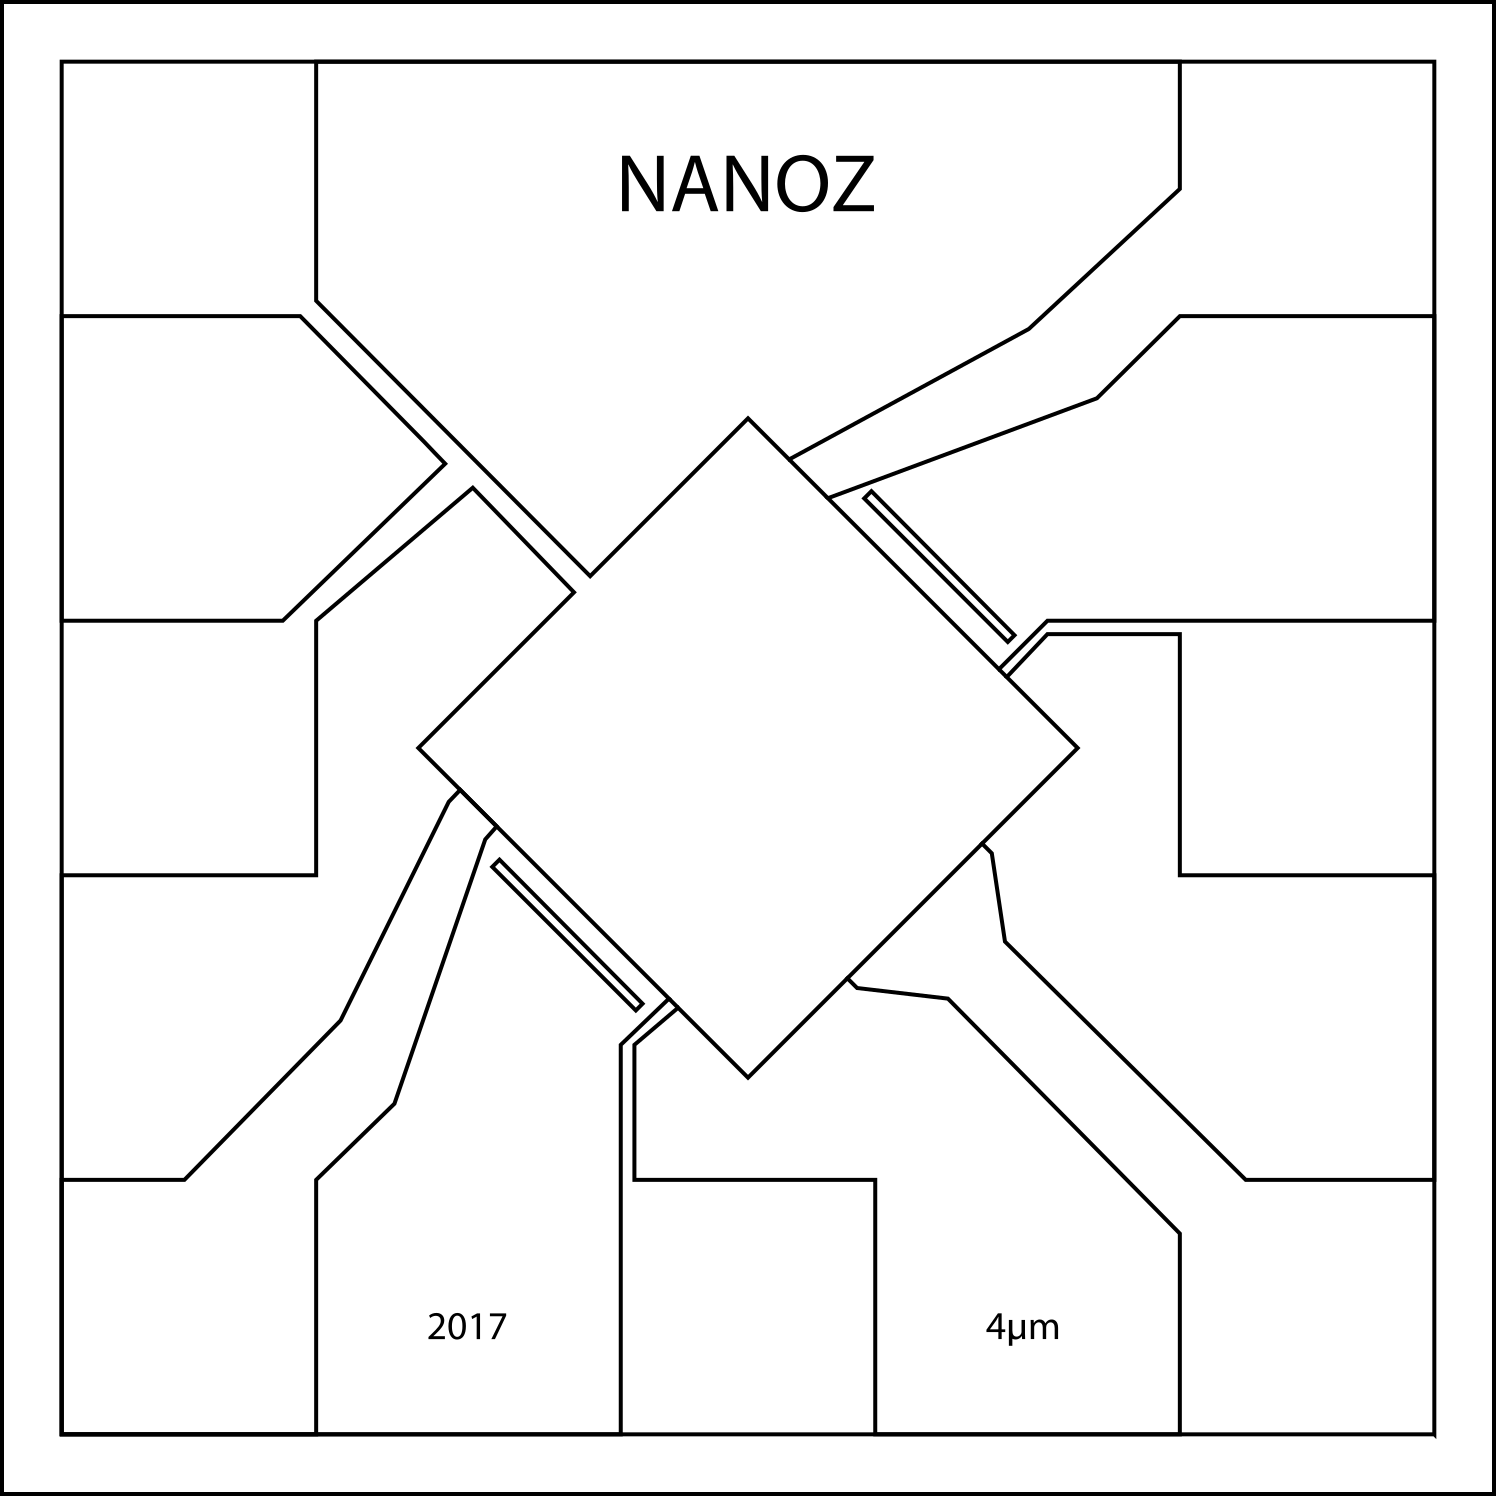
Die neuesten Nanoz-Gassensoren können in Uhren, Smartphones und andere Produkte integriert werden. Trotz ihrer kompakten Bauweise bieten unsere Sensoren eine viermal größere Detektionsreichweite als vergleichbare Modelle auf dem Markt.
A metal-oxide gas sensor measures a single quantity: how the conductance of a heated semiconductor layer changes when gas adsorbs onto it. You cannot tell from one number which gas caused it. That is precisely why MOx sensors have been cheap, robust and non-selective for forty years. NZGS 2 does not solve this with a better layer. It solves it with four measurements instead of one — and with a heater that never stands still.
The sensing principle has not changed since the 1970s. A thin layer of tin dioxide or tungsten trioxide is heated to between 200 and 400 °C. At that temperature oxygen ions bind to the surface and withdraw electrons from the semiconductor, so resistance rises. When a reducing gas arrives it reacts with those oxygen ions, returns the electrons, and resistance falls. An oxidising gas does the opposite.
This works reliably, which is why such sensors sit in millions of gas alarms, cooker hoods and air purifiers. But: acetone lowers the resistance. Ethanol lowers the resistance. Hydrogen, carbon monoxide, methane, ammonia — all of them lower it. The curve looks the same every time; only its height differs. And the height also depends on concentration. A 40 per cent deflection may mean 200 ppb of acetone or 2 ppm of ethanol. The sensor does not know which.
You might object that calibration solves this. It does, for a single known gas in a known environment: if carbon monoxide is the only thing that can occur, you convert the characteristic curve and get a usable concentration reading. The moment two gases can occur together, the method collapses — the curve carries no information about which share came from which substance. In real environments that is the normal case: a workshop holds solvents, exhaust and cleaning agents side by side; a battery room superimposes hydrogen and electrolyte vapour.
The industry's usual answer is to place several sensors with different dopings next to each other and offset their cross-sensitivities against one another. That improves matters without solving them — you end up with four similarly shaped curves at different amplitudes, and amplitude remains confusable with concentration. What is missing is a second dimension in which the gases differ.
NZGS 2 combines four measures, none of which is sufficient on its own. Only together do they produce a response pattern that can be attributed to a gas.
The die carries two different metal oxides. Tin dioxide (SnO₂) responds strongly to volatile organic compounds — acetone, ethanol, formaldehyde, BTEX — and equally to ammonia, methane and hydrogen sulphide. Tungsten trioxide (WO₃) has a distinctly different profile: it is sensitive to ozone, nitrogen dioxide and carbon monoxide, the oxidising gases where SnO₂ stays weak.
There is a physical reason for the difference. Both oxides are n-type semiconductors, but their surfaces form different oxygen species at different temperatures — and which species is present determines which molecules it will react with at all. In its favourable window SnO₂ works preferentially with the hydrocarbons; WO₃ binds where electrons are taken up rather than given back, which makes it the better choice for oxidising gases.
That already gives two viewpoints on the same gas mixture. A substance that acts strongly on SnO₂ and barely on WO₃ belongs to a different class than one where it is the other way round. On its own this is enough for a rough grouping, not for an identification.
Four sensing elements and two heating elements sit on a die of 1.15 by 1.15 millimetres. The whole thing is housed in a QFN-8 package of 2.8 × 2.8 × 1.6 millimetres — smaller than a lentil and flat enough for a smartphone or a watch.
The four elements are not four copies of the same sensor. They differ in layer, in position relative to their heater, and therefore in local operating temperature. An element closer to the heater runs hotter and favours different reaction pathways than one at the edge. A single gas event thus produces four responses that differ in timing and in shape.
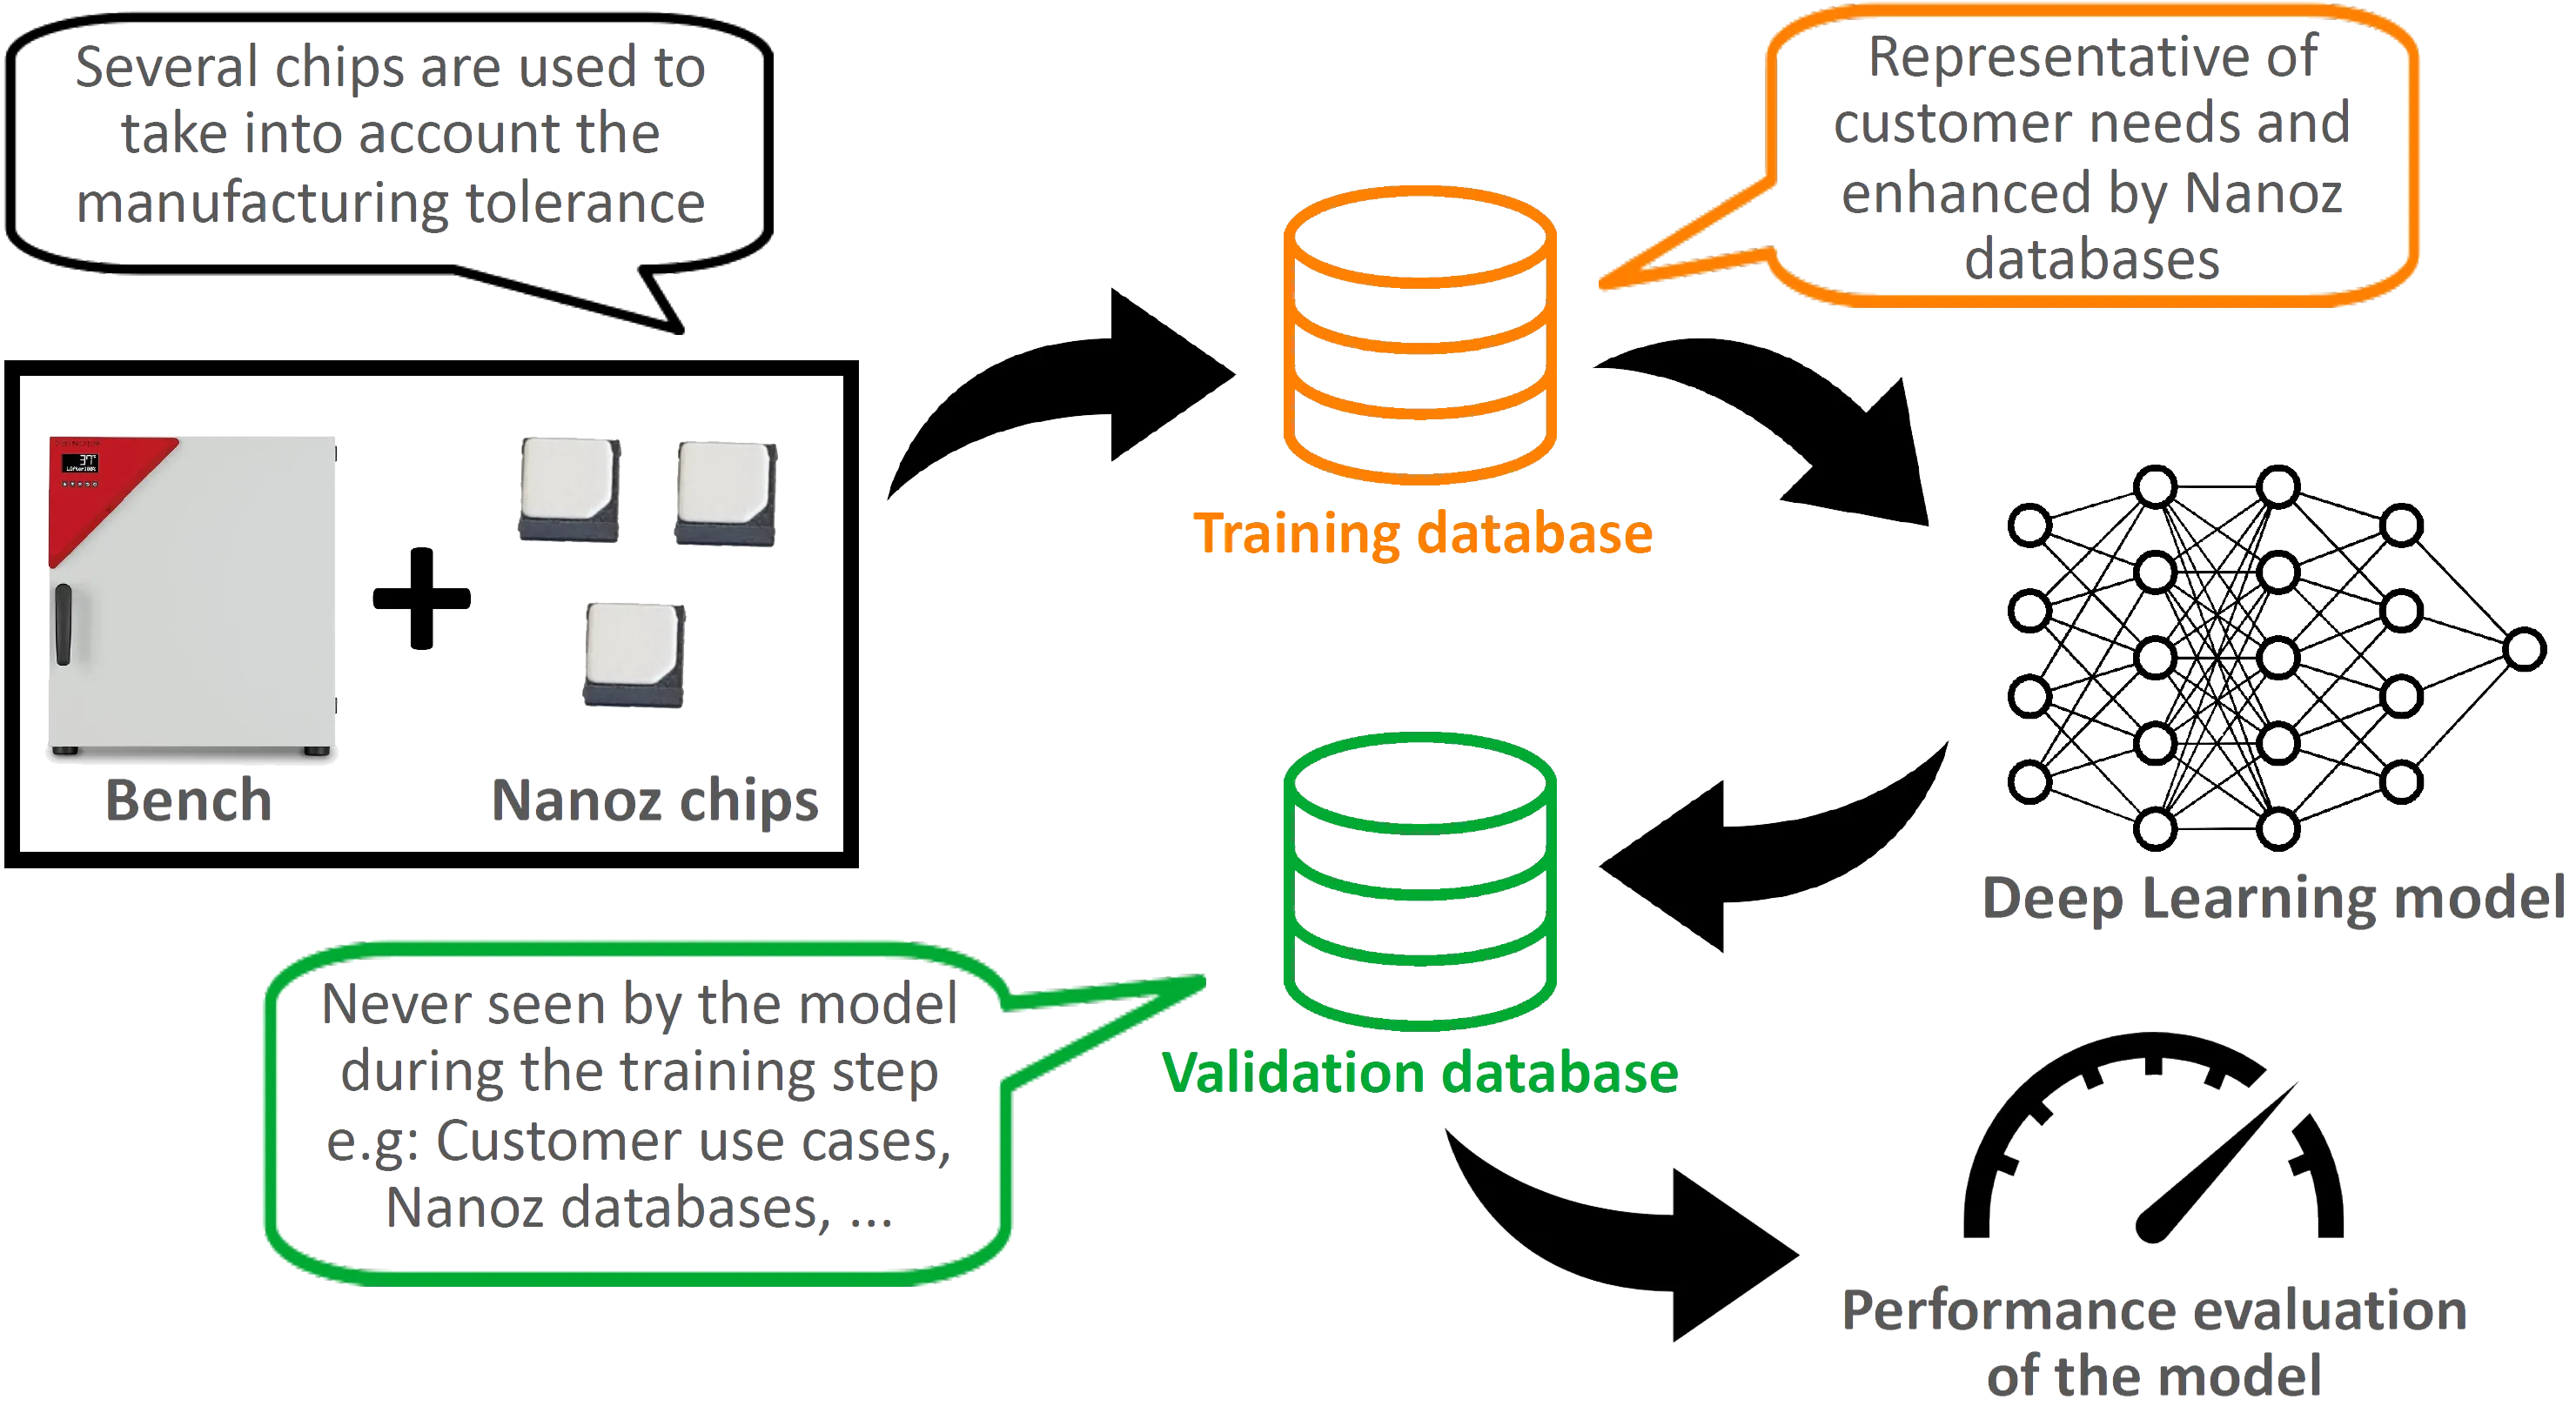
This is where the real trick lies. Instead of holding the heater at a fixed temperature, the heater voltage VH sweeps triangularly between 1.8 and 2.2 volts with a period of exactly six seconds. Sensor voltage VS sits between 0.7 and 1.0 volts, with an optimum of 0.8 volts.
The layer therefore continuously traverses a temperature range rather than sitting at a point. And adsorption, reaction and desorption depend on temperature differently for every gas. Acetone reacts in a different window than hydrogen; ethanol desorbs at different temperatures than ammonia. Across one period each gas therefore traces its own curve shape — with a characteristic lag behind the heater, its own edge steepness, and sometimes a second maximum where a further reaction pathway opens up.
Why triangular rather than sinusoidal or stepped? A triangular ramp passes through every temperature in the range at constant speed. Every point is therefore represented equally in the signal, and the steepness of the response edge can be read directly as a feature. A sine dwells longer at its turning points and over-weights the extremes; steps produce settling transients that mask the actual gas response. The six seconds are a compromise: short enough to follow changes in concentration promptly, long enough for the slower desorption processes to become visible at all.
An amplitude thus becomes a signature. And the period is not a guidance value: if the modulation deviates, every feature shifts and the patterns no longer match the trained model. Six seconds, 1.8 to 2.2 volts — otherwise selectivity is lost.
Seven quantities are computed from the response of each of the four elements:
Four elements times seven features give twenty-eight numbers per six-second period. In that feature space the gases no longer lie on top of each other but apart. A deep learning model assigns a new pattern to the nearest known class and estimates concentration. Principal component analysis makes the separation visible: project the twenty-eight dimensions onto two, and the gases form recognisably distinct clusters.
That the clusters separate is not incidental — it is the condition under which the method works. Where two gases overlap in feature space, no model however good will tell them apart; then you need either an additional measured quantity or a narrower definition of the task. This is why every new application begins with a training run using known samples, to establish whether the relevant substances actually do fall apart in feature space.
The datasheet gives warranted limits of detection for five gases. The lowest is 25 ppb for acetone; the right-hand column names the dominant layer in each case.
| Gas | Limit of detection | Sensitive layer |
|---|---|---|
| Acetone | 25 ppb | SnO₂ |
| Ethanol (EtOH) | 30 ppb | SnO₂ |
| Formaldehyde (HCHO) | 30 ppb | SnO₂ |
| Ethylene | 400 ppb | SnO₂ |
| Carbon monoxide (CO) | 900 ppb | WO₃ |
A range of further gases is also detected — hydrogen, ammonia, methane, hydrogen sulphide, nitrogen dioxide, ozone, nitrous oxide, BTEX and the electrolyte vapours EMC, DMC and DEC. The datasheet gives no warranted limits for these; measured values and test conditions are provided per project on request.
The values were determined under controlled laboratory conditions: 24 hours of stabilisation, 25 °C, 45 per cent relative humidity. The datasheet states explicitly that these are typical characteristics which vary from chip to chip and depend heavily on the specific application. For an alarm threshold what counts is therefore the reproducibility measured in your own gas matrix, not the catalogue figure.
| Parameter | Value |
|---|---|
| Die size | 1.15 × 1.15 mm |
| Package | QFN-8, 2.8 × 2.8 × 1.6 mm |
| Sensitive layers | SnO₂ (VOCs) + WO₃ (O₃, CO, NO₂) |
| Heater voltage VH | 1.8–2.2 V, triangular, 6 s period |
| Sensor voltage VS | 0.7–1.0 V (optimum 0.8 V) |
| Power consumption | approx. 70 mW |
| Operating temperature | −10 to +85 °C |
| Operating humidity | 15–90 % RH, non-condensing |
| Storage temperature | −40 to +125 °C |
| Storage humidity | 10–95 % RH, non-condensing |
| Protective filter | hydrophobic, 0.1 µm |
| Heater resistances | Rₕ₁ 111 Ω, Rₕ₂ 118 Ω |
| Sensor resistances | 155–550 kΩ per element |
| Pre-heating | 24 h at 2.3 V heater / 0.8 V sensor |
Power consumption is worth noting. Around 70 milliwatts is roughly one tenth of what heated single-gas sensors of comparable sensitivity draw. That is the difference between a sensor that needs mains power and one that fits into a battery-powered device.
No sensing principle is right for everything. The table below places NZGS 2 alongside the methods that come up for the same applications.
| Principle | Selective? | Typical range | Note |
|---|---|---|---|
| NZGS 2 (MOx + AI) | yes, via pattern | from 25 ppb | 14 gases, approx. 70 mW, 2.8 mm; training required per gas matrix |
| Conventional MOx | no | ppb to ppm | cheap and robust, but every reducing gas looks the same |
| NDIR | yes, per absorption band | ppm | very stable and long-lived; blind to gases without IR absorption such as H₂ and O₂, larger package |
| Electrochemical | yes, one gas per cell | ppb to ppm | very low power; the cell is consumed and needs replacing after a few years |
| PID | no, total VOC | ppb | sensitive across many VOCs but does not distinguish them; the lamp ages |
| Thermal conductivity | limited | per cent range | proven for H₂ at high concentration; unusable at ppb level and in mixtures |
The practical conclusion: if you are monitoring one known gas in a known environment, an electrochemical cell or NDIR is often the cheaper route. As soon as several gases are in play and the package has to be small and the power budget low, there is currently little alternative to the pattern-based MOx approach. A detailed comparison including measured data is available on request.
Thermal runaway in a lithium-ion cell progresses through four stages. In stage 1 electrolysis produces hydrogen at cell level. In stage 2 the electrolyte solvents EMC, DMC and DEC escape. Stage 3 is the first venting event: carbon monoxide, hydrogen and electrolyte gases spike. Stage 4 is runaway proper, with massive gas release — too late for safe intervention.
Thermal-conductivity devices measure hydrogen only and typically alarm at stage 3. NZGS 2 detects the stage 2 electrolyte vapours — before venting. The difference is not academic: it decides whether an alarm is an early warning or a damage report.
Hydrogen is detected far below its lower explosive limit — for fuel cells, electrolysers and hydrogen boilers that means a leak shows up long before it becomes a safety problem. And because the sensor simultaneously distinguishes H₂ from CH₄ and CO, a genuine leak can be separated from an interferent. Specific limits of detection for hydrogen are provided per project; the datasheet does not list them.
Indoors the relevant quantities are formaldehyde from building materials, BTEX from solvents and carbon monoxide from combustion; outdoors nitrogen dioxide, ozone and CO. NZGS 2 covers both sides because it carries both layers. From the individual values a combined air quality index can be computed that does not merely report “air is poor” but names what is making it poor.
Exhaled breath carries VOC signatures that research associates with metabolic and disease states — acetone above 1.8 ppm in diabetic breath against 0.3 to 0.9 ppm in healthy subjects, aldehyde patterns in lung carcinoma, carbonyl sulphide in cystic fibrosis. The requirement here is selectivity at low concentrations in warm, humid air. To be clear: NZGS 2 is a sensor component, not an approved medical device, and does not replace a diagnosis.
Ethylene governs the ripening of fruit and vegetables and is measurable from 400 ppb. Spoilage announces itself through a shift in the VOC signature before it becomes visible or detectable by smell. Both are applications where no absolute value matters, only the detection of a change in pattern — which is exactly what the sensor is built for.
NZGS 2 is a component, not a finished instrument. Five points determine how demanding the integration will be — and they belong in the early concept phase, not in commissioning.
None of this is unusual for a gas sensor with ppb resolution. But it is the reason we recommend evaluating with the kit before a board is laid out.
Four constraints worth knowing before integration. We name them here because engineers look for them anyway — and because it is better to settle them in the first round than in the second.
The basis is patent US 2016/0238548 A1 — Heated sensitive layer gas sensor with multiple supply points for extended lifetime. The patent is held by the French CNRS and Aix-Marseille University; NANOZ holds an exclusive licence. The multiple supply points to the heated layer that give the patent its name are also the reason for its lifetime: they distribute the thermal load and slow the ageing of the contacts.
The NZGS 2 datasheet is issued by NANOZ; the sensor was developed in the environment of the CNRS and Aix-Marseille University, where the patent also sits. The contact for the German-speaking market is TSR Messtechnik AG in Schaffhausen, Switzerland, which has built instrumentation for industrial applications for decades — flow measurement, differential pressure, calibration to ISO 17025.
Whether a sensor holds up in an application is not decided by the datasheet but by the measurement. An evaluation kit with read-out electronics and software is available, so the response in your own gas matrix can be recorded before an integration is planned.
The full datasheet — pinout, electrical specifications, test conditions and calibration curves — is sent on request, without a form. Common questions on calibration, storage and operating limits are answered in the FAQ; the application fields are set out under Applications.
Tell us what you need to measure and in what environment. We will come back with an assessment of whether and how NZGS 2 suits it — and we will say so if it does not.
Send an enquiry